Tuesday, December 31, 2019

Temperature Quilt - Finding Recent Weather Data

Updated 1/17/2025


Are you ready? If not, that's OK. It's never too late to start.

I'm SO excited about the success of the Facebook group! I feel like this will be a wonderful place to share, ask questions, and stay motivated and on track.

Today's question:

Where do I find recent weather data?
I recommended the NOAA website for historical data for planning purposes because it allows you to download spreadsheets. It won't, however, really work easily for more recent temperatures.

I recently discovered that the way recent temperatures are recorded varies from source to source. It could be sunrise to sunset, midnight to midnight, or a number of other iterations.
Historical data (like on the NOAA website) seems to always run from midnight to midnight.

The problem? If you ever fall more than a month or so behind, you risk the chance of suddenly having a whole different set of data!

If you are certain that you will not fall too far behind, weather.com, which is The Weather Channel's page, is still the simplest way to find your daily temperatures. They do not, however, record midnight to midnight highs and lows. Don't ask me how I know....

After much research, the only place I could find confirmed midnight to midnight recorded temps, was weather.gov.
Unfortunately getting to the information is a little harder. You will have to input the date every day, which is not the end of the world.

Using weather.gov

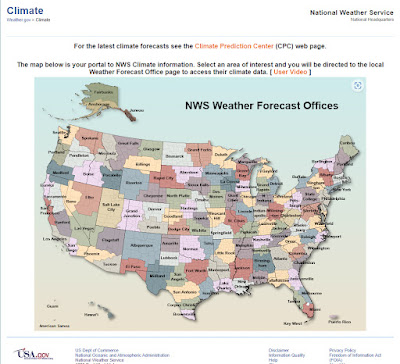
This link will get you to the correct page on the website. The rest is a little counter intuitive.


On the map, click on the approximate location for which you would like to see data.
You will now get a list of possible locations, but if you want to be more precise, click on "View map".


This map will show you all the stations in the area you chose on the initial country map. You can zoom in to see individual stations more clearly.


Select your preferred station. On the next screen, select "only data for a month", and the month you are interested in and press "Go".


You will have to follow these steps every time you want to get updated data so, if you're keeping up day by day, you have to do this every day. It also doesn't seem like you can download the data.


This is the method I am using this year because we have a lot of travel planned and I am DEFINITELY going to fall behind.


Using weather.com

You can see a whole month's minimum and maximum temperatures in one, as well as precipitation and even whether it was sunny or cloudy, but these temps are not recorded for a 24-hour period but use a different algorithm.

Here's December 2019 for Des Moines:
The greyed out days are past and the temperatures are the actuals. The days with black text are forecasts.

How do I get here?
Go to weather.com and enter your city into the search box at the top of the page.

At the top of the next page, select "Monthly".

It will default to the current month, but you can get data up to a year in the past.
And if you drag the link into your favorites bar, you will never have to type a url again!


I hope this helps. If you have any questions, leave a comment and I will answer in the comments so everyone can see my answers.
Or...join the Facebook group or follow #tempquiltalong on Instagram.


Friday, December 20, 2019

Temperature Quilt - Planning 3

Okey-dokey, now we have our temperature ranges, number of fabrics, and design all figured out. Right?

The next decisions are colors, fabrics, and yardage.

Which colors & fabrics should I use?
The norm is to use cool colors (purple, blue, green) for cooler temperatures and warm colors (yellow, orange, red) for warmer, but you can do whatever pleases you.
What is important is that you have a variety of either color OR value (light, medium, dark) or both.
I'm doing solids/tonals but you can certainly assemble a collection of small or tonal prints and work with them.
Last year the hubby suggested I use 50 shades of grey but I decided to pass.

This is my fabric chart for 2020.  I'm using 24 colors of Moda Grunge. You can download a free blank fabric chart for adding your own temperature ranges and fabrics in the sidebar.

A couple of fabric ideas. I'm giving credit to each quilter, so please click on their Instagram account names for more inspiration.

Ange (@angesullivan) used a variety of tonal prints.
 
 
Batiks like these Eve (@evequilts77) used are a popular choice.
   

More batiks.  From Lynn (@thethimblemouse).
 

Here are Karen's (@capitolaquilter) fabrics - tonal prints.

Joanna (@joanna_kent) used tonals too. Notice how she used a vertical design. These are the first 10 months of the year.

How much fabric do I need?
Well, this depends on the size of your quilt, the intricacy of your blocks, and how many different fabrics you're using.
If you choose to used a basic like Bella Solids, Moda Grunge, or another fabric that is always available, you can order more if you do run out.

You can use historical data to determine how many times a specific fabric is likely to be used in your quilt, and get a rough idea of the yardage you'd need.  Of course, some fabrics are likely to only appear a couple of times (hello 100+ degrees!) so, if you're purchasing a bundle, go with the temperature that is likely to occur most often. It'll likely be somewhere in the middle of the scale.

UPDATE: There is a new post where I share another way to determine how much yardage you may need for your quilt:

Wednesday, December 18, 2019

Temperature Quilt - How to obtain weather data from NOAA

Quite a few quilters have had trouble navigating the NOAA site in order to get a hold of historical data for planning purposes, so I thought I'd post a step-by-step tutorial of sorts.

1. Go to this page online: https://www.ncdc.noaa.gov/cdo-web/ and click on "Search Tool".


2. On the next page, select "Daily Summaries" and the date range you would like data for. It defaults to the current year but for planning purposes I suggest 2 full years.

3. Select "Stations" in the Search For box and type your city or airport. Click on "Search".

4. A map will pop up with a selection of stations. You may have to zoom in to get closer to your location. Before choosing a location, check to make sure all the data for that station is available.
Airports are the most reliable. Many smaller stations are backyard weather stations and data may not be updated regularly. You can download the data for a station and check to see how often it is being updated.

5. Click on "Add to Cart" for your selected station.

5. On the top right of the screen, click on "Cart" and "View all Items".

6. Select your cart options.

If you'd like to use Excel (or other software that can read CSV files), choose the CSV option. This will be the easiest way to play with data.
If you do not have Excel, you can select "Daily Text".

Check and make sure your dates and station are correct and click "continue". It sometimes defaults back to the current year, so be sure to check again.

7. On the next page, select "Station Name" and the data you would like to receive. I usually only choose "Air Temperature" but some quilters like to add something extra to indicate precipitation on their quilt.

Click "Continue".

8.  Double check all the information on this page and enter your email address. NOAA will email you a file with your data.

Voila!

UPDATE 12/29/2020:
Apparently there are locations for which the NOAA site does not have a whole lot of data.
I have been told that Farmer's Almanac is another source to look at, as well as Weather Underground.


Tuesday, December 17, 2019

Temperature Quilt - Planning 2

Now that you've (hopefully) figured out your temperature ranges and number of fabrics, it's time to think about design.

Quilt Layout
The most popular options for your layout are linear or vertical.

1. linear - start with your first block at the top left just add the next one the the right of the previous one. If you decide on this option, you will have to think about the shape you want your quilt to be so you know when to start your next row (or you will just have one 365 block long strip, which would make an interesting runner).

I tried to have it be square-ish. I ended up with 19 columns and 20 rows - that's 380 total blocks so I'll have to get creative with the extras.

This is my design for 2020 using the Moda Grunge 24 color bundle. As you can see, I have extra blocks.  
Blocks start with January 1st as the first block, then going row by row like reading a book until December 31st.

And this was my design for 2019 using the Bella Solids 24 color bundle (although I ended up changing the position of the blank blocks a bit).

2. vertical - this works especially well with rectangular blocks like flying geese. If you choose this option, you will have 12 columns (one for each month) and 31 rows. Some columns will have fewer blocks but you can add blank ones to the bottom for the shorter months.
This is Tina's 2018 Temperature Quilt (@seasidestitches on Instagram). She changed the direction of the flying geese depending on whether the temperature was falling or rising.

3. 12 blocks - you could also make just one block a month, like Kelly (@itsjustsew on Instagram) did. Aren't these lovely?

There are, of course, many other options.  You are only limited by your imagination.

Block Type
I thought about giving you some examples of blocks to use but, honestly, the possibilities are endless.
I recommend either Googling "temperature quilt" or looking at the #temperaturequilt and #tempquiltalong tags on Instagram.

In the next post we'll talk about fabric selection and color choices.

Monday, December 16, 2019

Temperature Quilt Planning - 1

Ready to start your Temperature Quilt? I'm going to try to provide some guidelines for planning if you haven't already done so. It'll be spread over a couple of posts.

What is a Temperature Quilt?
The premise of a temperature quilt is to make a 365 block quilt where each block has the low and high temperature for a day represented, using a color for each temperature (or range of temperatures, because having a unique color for every temperature would be close to impossible).

If you Google "temperature quilt" or look at the #tempquiltalong or #temperaturequilt hashtags on Instagram, you will find many, many amazing examples of past quilts, and different interpretations of the idea.

Options for participating
- Follow the hashtags #tempquiltalong and  #temperaturequilt on Instagram
- Post your progress on Instagram using the hashtags #tempquiltalong and #temperaturequilt
- Follow @twiddletails on Instagram.
- Follow Twiddletails on Facebook and join the Temperature Quilt Along Group.

Schedule
Between now and January 2nd: Plan your quilt design and colors and gather your fabric
Every day, until January 1st of next year: Make a block using the previous day's high and low temperatures
Next January: Assemble and complete your quilt.

Choosing your colors/fabrics and temperature ranges
As far as colors/fabrics and temperature ranges, you can approach it from two angles - 1. choose your colors first, then your temperature ranges or 2. choose your temperature ranges first, then find colors/fabrics to fit them. It's up to you.

Color/fabric decisions:
I would not recommend using fewer than 12 colors. The fewer colors, the more repeats of identical blocks and the result could be a fairly washed out look. Using historical data (see below), I did mock-ups for Des Moines using both 12 colors and 24 and they both looked pretty good.

This is the 24 color version:
And this is the 12 color version:
All in all not that much of a difference.

Choosing temperature ranges:
You will need a temperature range for each color you have.

If you've lived somewhere for a couple of years, you will know what typical temperatures are for your home.

Think of the highest and lowest temperatures you will typically have in a year.  Here in Des Moines temps can range from less than -20 to 100+ but it typically will not get much colder than -15 or much hotter than 95.

I decided to divide the temperatures in 5 degree increments, using 24 colors. You can see my ranges and fabrics below. I have bundles available, which would eliminate some of the planning.

The smaller the difference between the highest high and the lowest low is, the smaller your increments should be in order have at least 12 ranges.
I recommend playing around with it a bit. There is a link to a free PDF Fabric Planning Sheet in the sidebar.

If you are Type A like me, read on...

To help you make your decision, you can download historical data on the NOAA website: https://www.ncdc.noaa.gov/cdo-web/.

Use the search tool and choose "daily summaries", NOAA will send you a free file with all the data you need. I recommend looking at 2 years' worth of data to get a better idea.

In my next post, I'll discuss design.

Please feel free to ask questions in the comments below and I will answer all questions in the comments so everyone can see them.

Remember to follow along and post your progress on Instagram using the hashtags #tempquiltalong and  #temperaturequilt.

(I'll be adding a link to each Temperature Quilt post in the right sidebar so you can jump directly to where you'd like to be.)

Fabric bundles:

Bella Solids 24 color bundle